Style Compatibility for 3D Furniture Models
The supplemental material is organized by sections corresponding to the structure of the paper. Please scroll down to the section of interest and click on any of the images to access detailed results.
Section 3: Crowdsourcing compatibility preferences
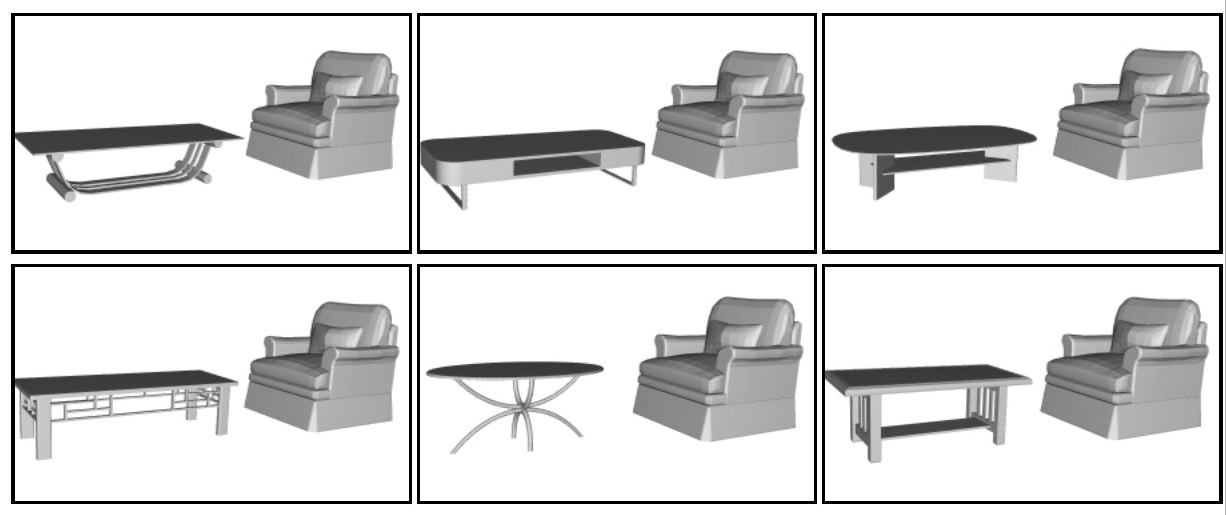
Clicking on the image below shows instructions and an example HIT for the Amazon Mechanical Turk study used for crowdsourcing people's compatibility preferences.
Clicking on the images below opens a directory of PDF files that show detailed results of how consistent participants of the Amazon Mechanical Turk study are at selecting compatibility preferences. Each PDF file shows the participants' consistency in one pair of object classes (e.g. pick the best chair given a table). Each PDF includes 50 tasks. In each task, we asked each participant to pick two combinations that are most compatible. The number below each image is the fraction of times that the combination was selected by participants. The total of fractions is 2. The score of each task is the p-value, computed by binomial test for the following null hypothesis: people do not have preference among the 6 candidates. Lower score means the distribution is more different from chance, and there is thus higher consistency among participants.
Living room: | 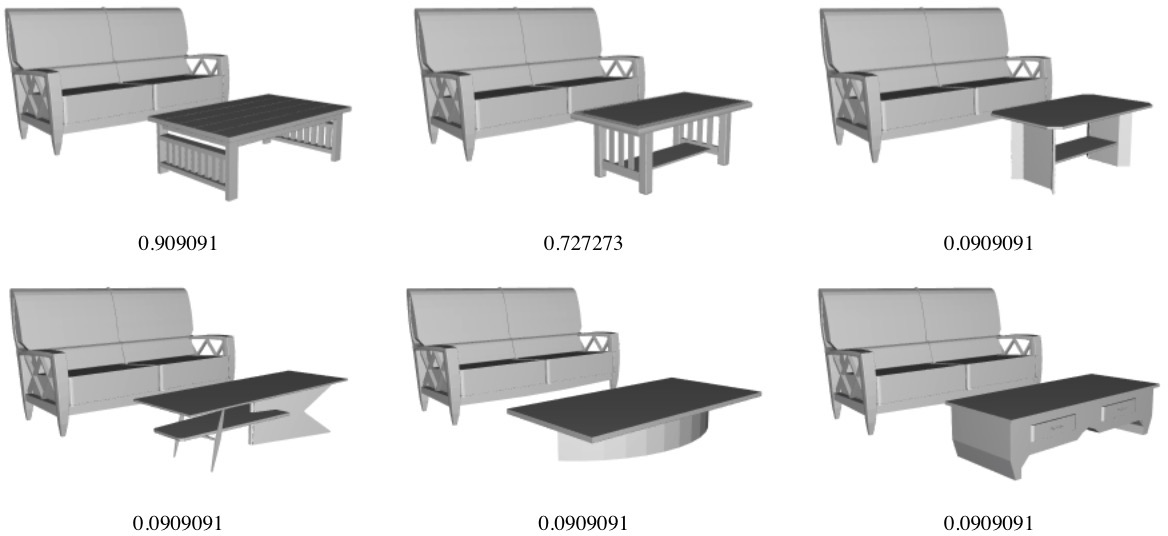 |
Dining room: | 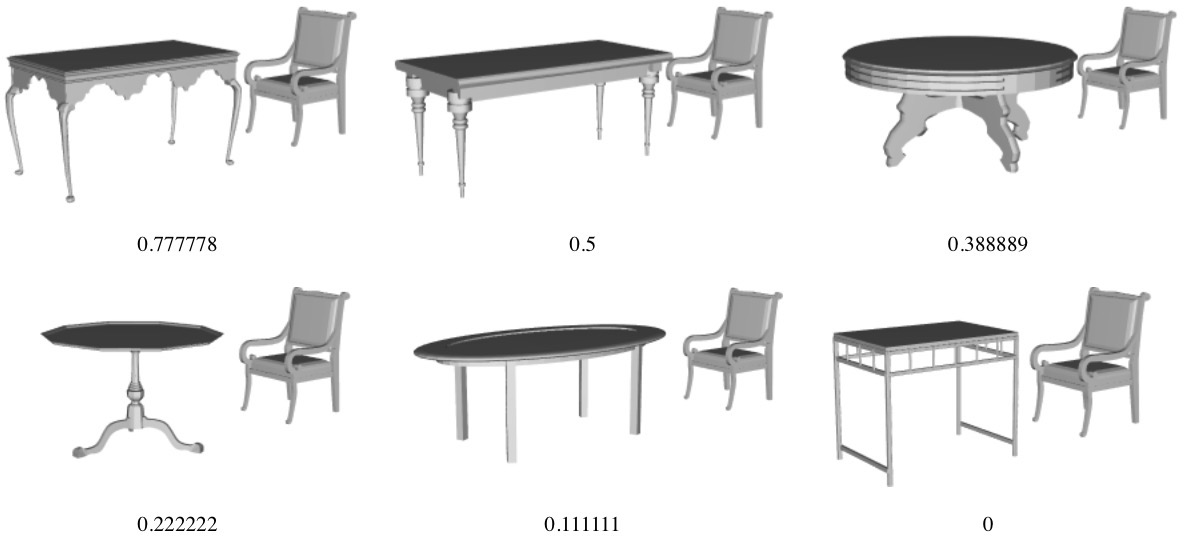
|
Section 4: Part-aware Geometric Features
The following text provides details for the geometric feature vectors computed for each part and the entire shape. We compute curvatures, shape diamter function, bounding box's dimensions, and normalized surface area as follows:
- Curvatures. We first uniformly sample 10,000 points on the surface. Then, we compute curvatures for each sample point p using two different neighborhoods. The first neighborhood includes the sample points that are within 0.5 feet from p. The second neighborhood includes sample points in the first neighbhood with normal directions within 60 degree of p's normal direction. Compared to [Kalogerakis et al. 2012], we additionally consider the curvatures computed without thresholding normals in order to distinct flat area from splat, which is a common structure in furniture models. In the end, we compute and concatenate histograms of the following descriptors for the entire part/shape (1) K1 (the principle curvature with larger absolute value) with thresholding normal (2) K1 without thresholding normal (3) K2 (the other principle curvature) with thresholding normal (4) K2 without thresholding normal. Each histogram is a concatenation of a 7-dimensional cumulative histogram and a 8-dimensional regular histogram.
- Shape diameter function. We use the same 10,000 sample points as for computing curvatures. For each sample, we compute shape diameter by averaging sample rays at cones of angles 0,15,30,45 degree. We then compute a histogram for the part/shape with a 7-dim cumulative histogram and a 8-dim regular histogram.
- Bounding box's dimensions. We compute the axis-aligned bounding boxes of each part/shape (assuming the entire shape is aligned to x-y-z axes), and use dimensions of the bounding boxes as features (3 dimensions).
- Normalized surface area. We compute the surface area of each part, and normalize it by the surface area of the entire shape.
If a certain part is missing from a model, we set its normalized surface area to 0, and fill in the other dimensions in the feature vector using the average values of corresponding dimensions computed from other models in the same object class.
Section 6: Results for triplet prediction
Clicking on the images below opens PDF files that show the compatibility distances predicted by our algorithm on all test triplets).
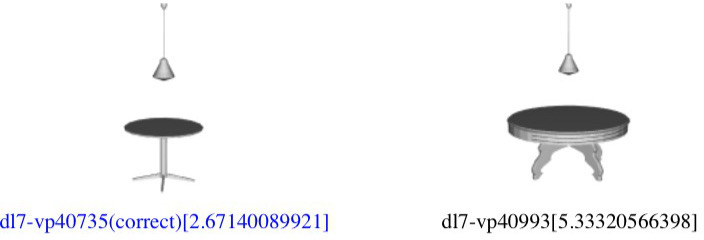
Each triplet consists of two pairs of models with one model in common. For these test sets of triplets, most people agree the pair shown on the left is more compatible than the pair on the right. Under each pair, the names of the models connected by hyphen are followed by the compatibility distance predicted by our algorithm in square brackets. The pair with smaller compatibility distance is colored. Blue text means the algorithm's prediction is correct (consistent with people's opinion), and red text means the algorithm's prediction is wrong.
Living room: |
 |
Dining room: |
 |
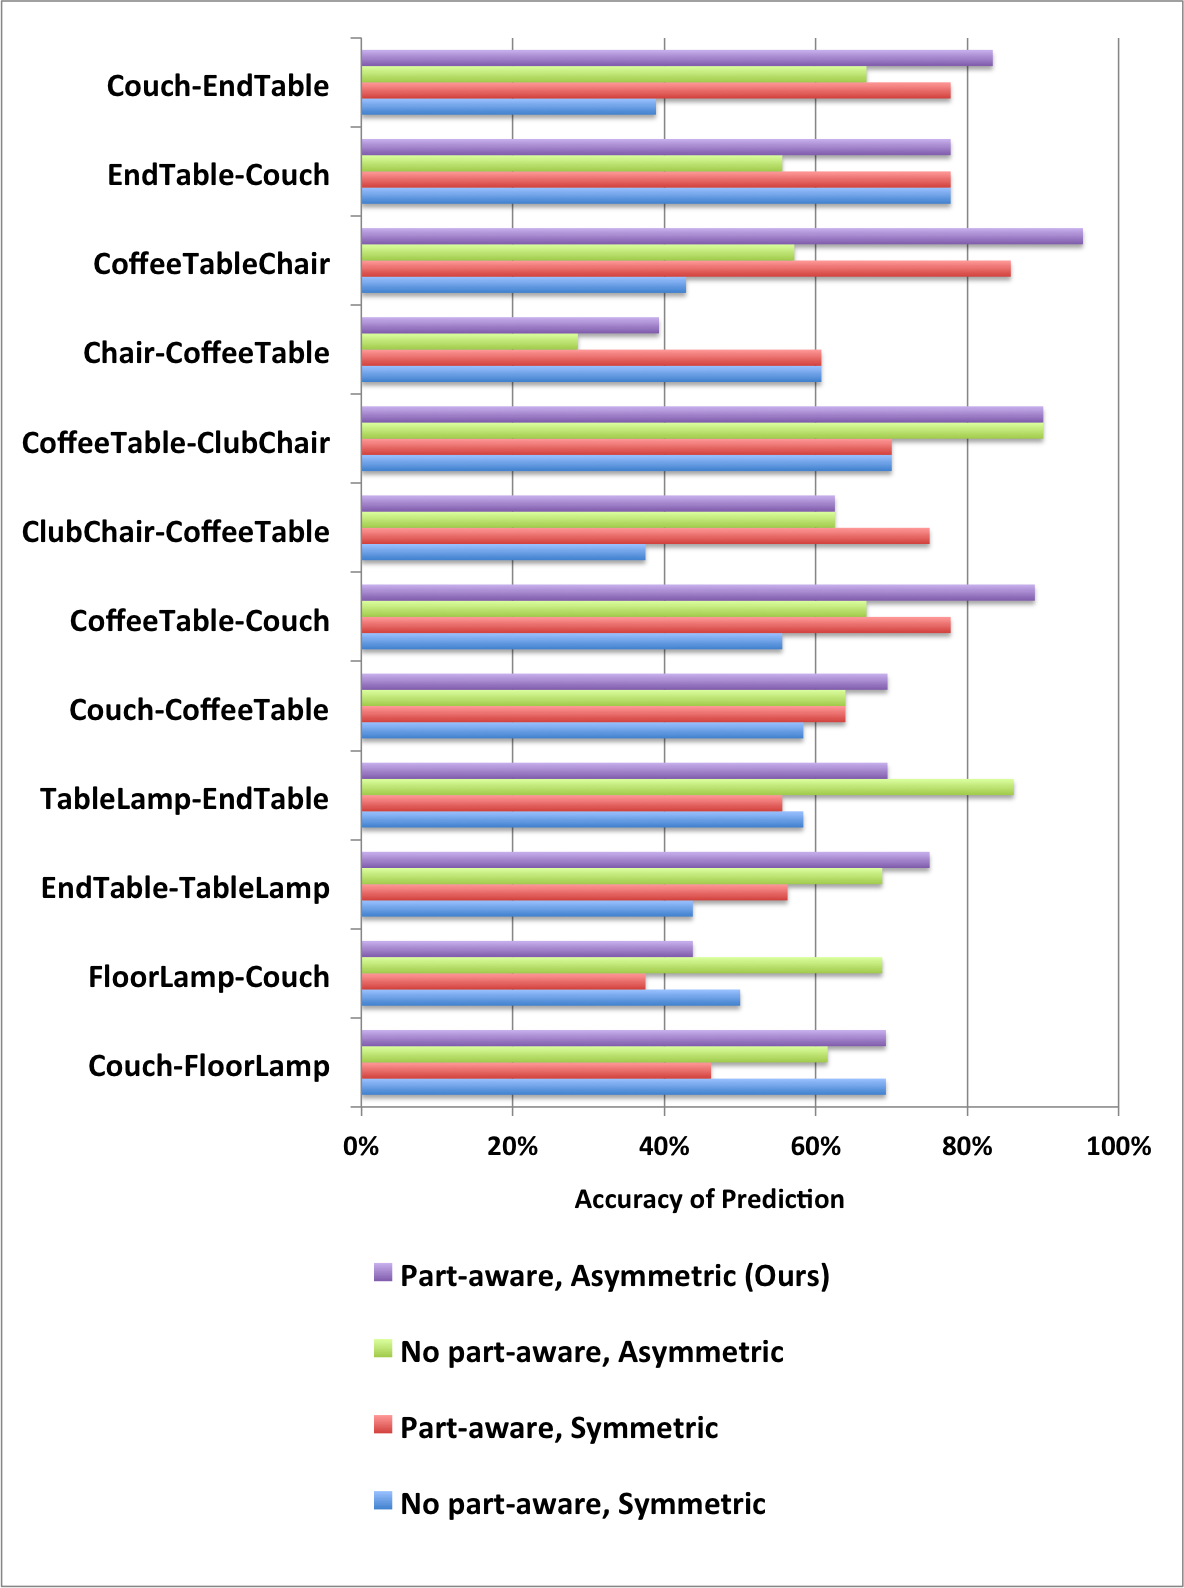
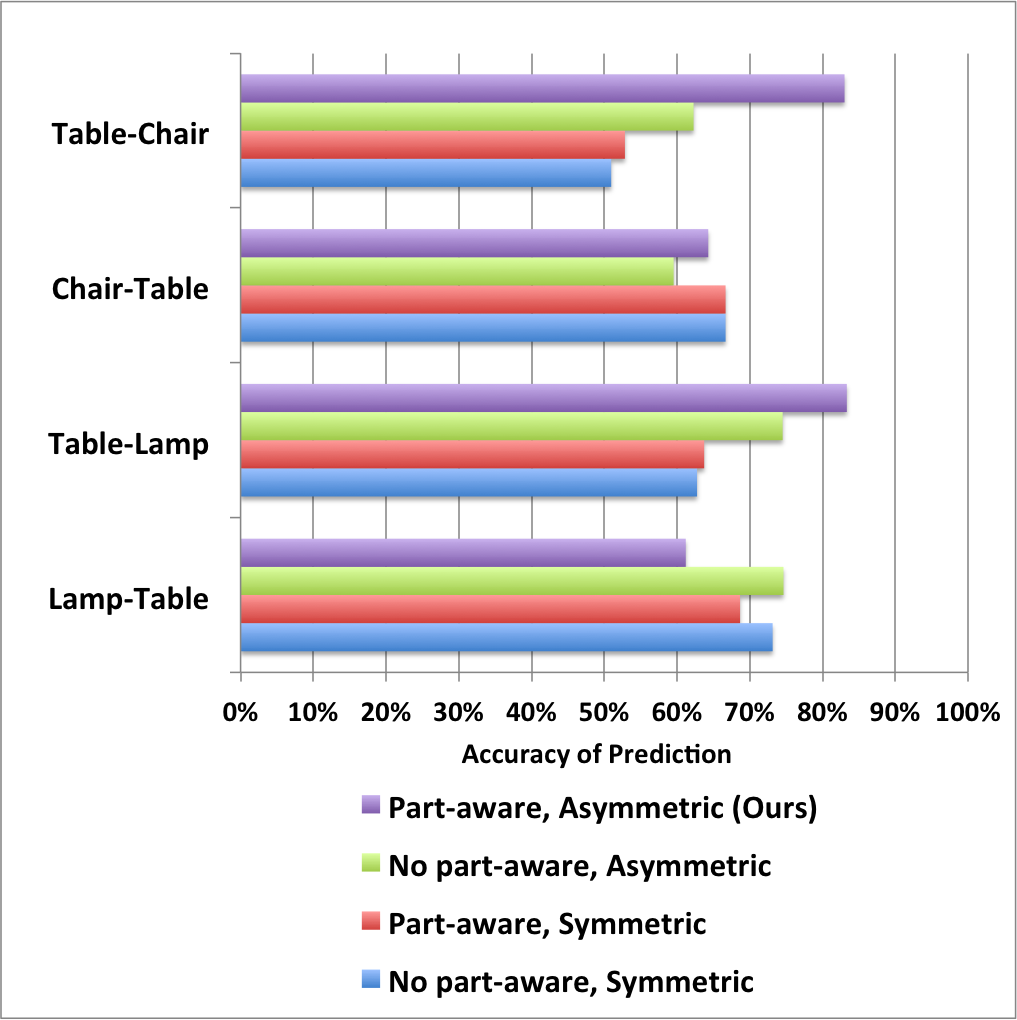
Clicking on the images below opens images that show bar charts comparing our proposed learning method (Ours) to variants that do not use part-aware geometric features (no part aware) and/or use a single matrix for embedding (symmetric). These results are akin to the ones in Table 2 of the paper, but provide results separately for each pair of object classes.
Living room |
Dining room |
 |
 |
Section 6.1: Style-aware shape retrieval
Clicking the image below opens a PDF file that shows the results of our shape retrieval experiment. For every query model, the first row shows the models that are most compatible to the query, and the second row shows the most incompatible ones for comparison. The number below each model indicates the predicted compatibility distance between query and the model. Lower values mean higher compatibility to the query.
Living room: |
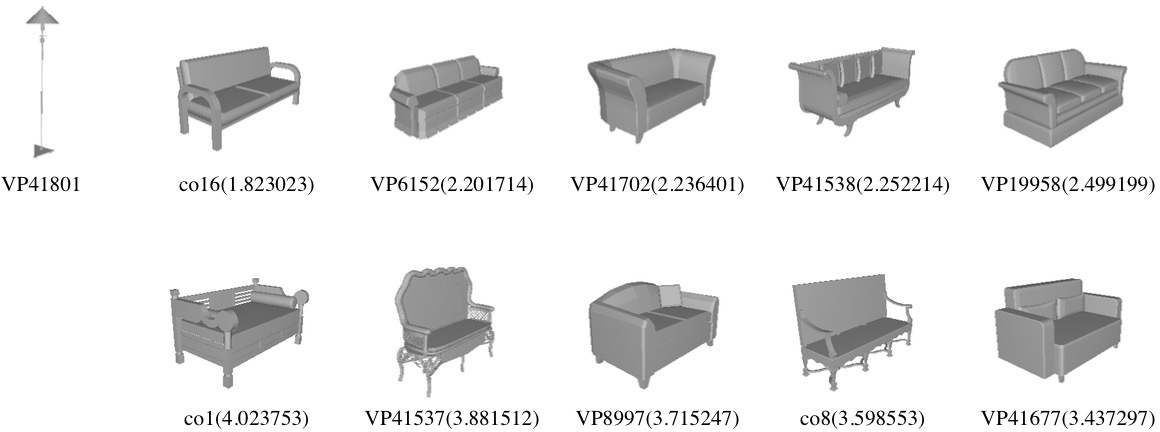 |
Dining room: |
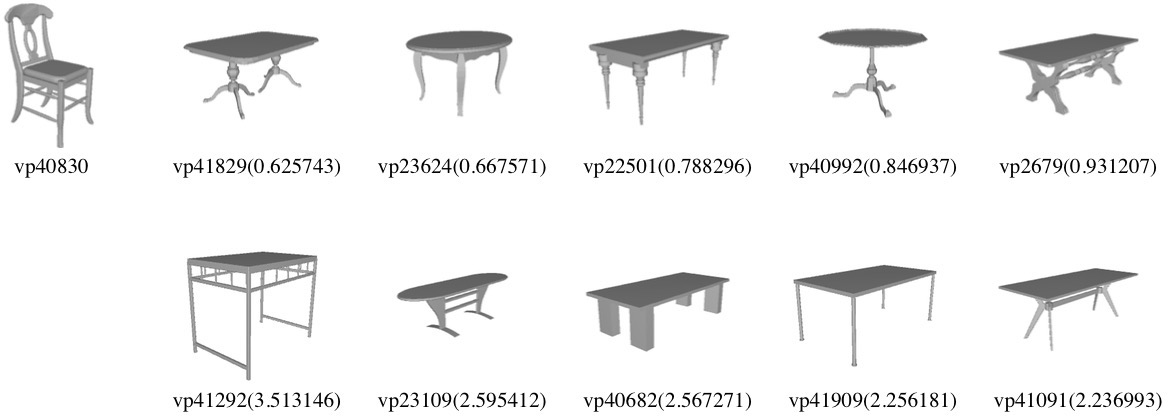 |
Section 7.2: Style-aware furniture suggestion
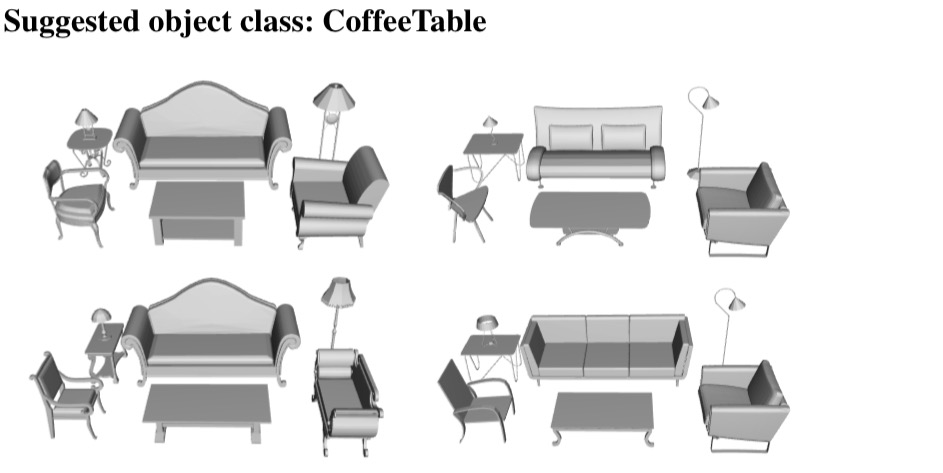
Clicking the image below opens a PDF file that shows all results generated by our algorithm in the experiment to evaluate our style-aware furniture suggestion application. In each scene, models for all but one object class are fixed, and our system provides a suggestion for the "suggested object class". For example, if the suggested object class is CoffeeTable, as in the example below, then the coffee table is the one suggested by our algorithm based on its compatibility with the rest of the scene.
Clicking the image below opens a PDF file that shows an exemplar hit of the user study performed on the Mechanical Turk to compare the compatibilities of scenes created during our furniture suggestion experiment.
Section 7.3: Style-aware scene building
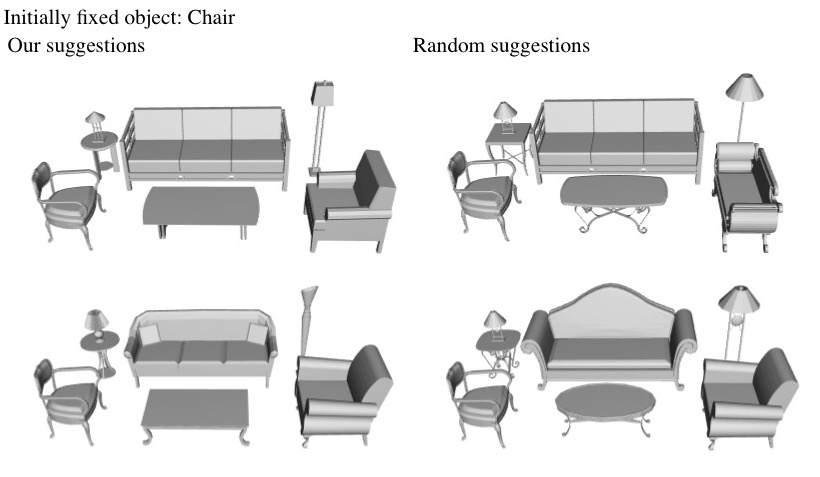
Clicking the image below opens a PDF file that shows all the scenes created by participants of our scene builder experiment. In each task, we initially fix one object (indicated by the text above each group of images). We list all the results created with the help of our suggestions on the left, and the ones created with the help of random suggestions on the right.
Clicking the image below opens a PDF file that shows an exemplar hit of the user study performed on the Mechanical Turk to compare the compatibilities of scenes created during our scene builder experiment.
