Link to all examples
Link to all examples
Link to all examples
Link to all examples
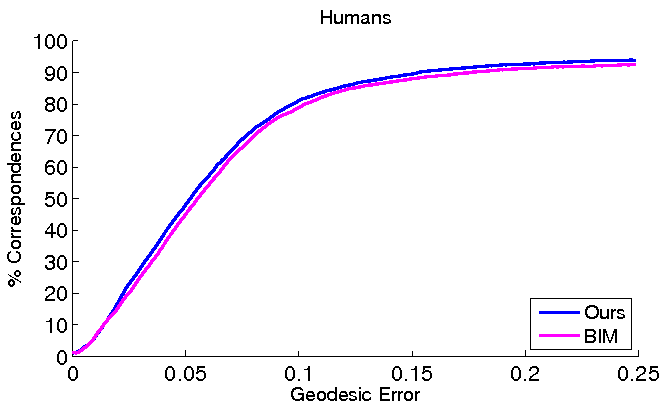
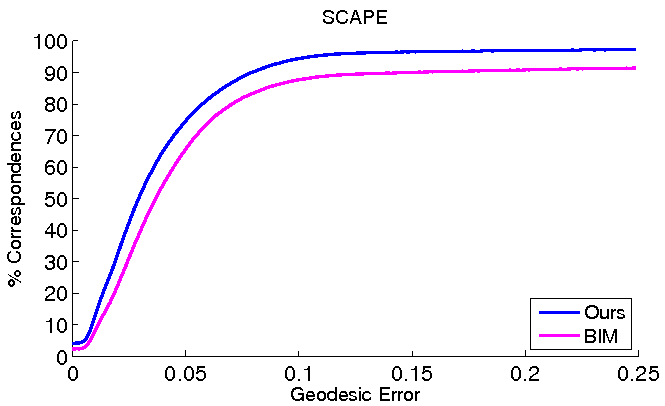
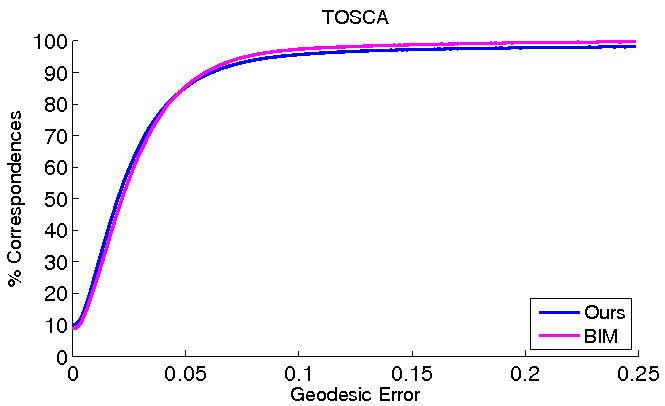
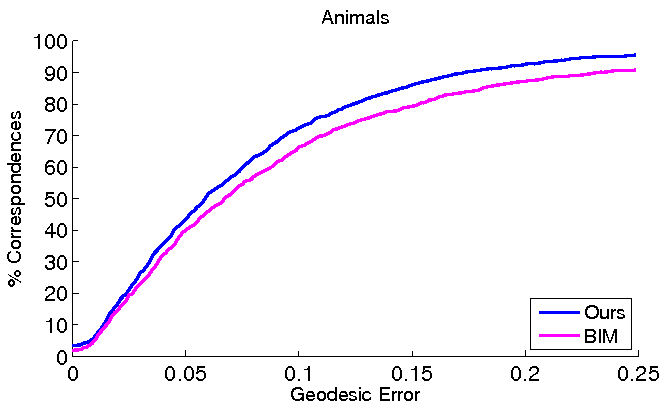
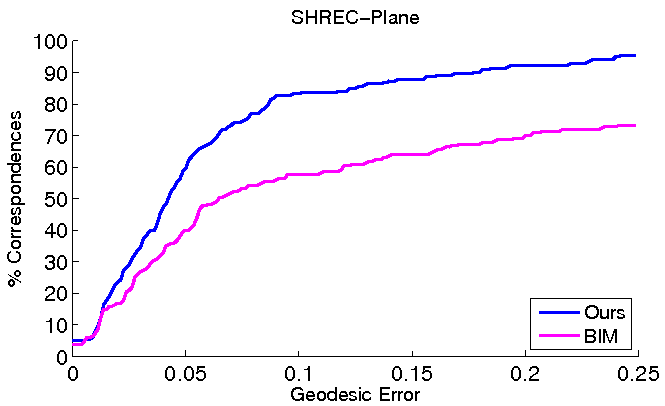
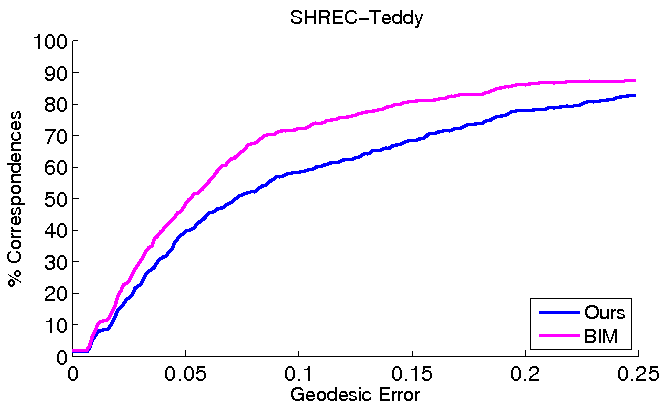
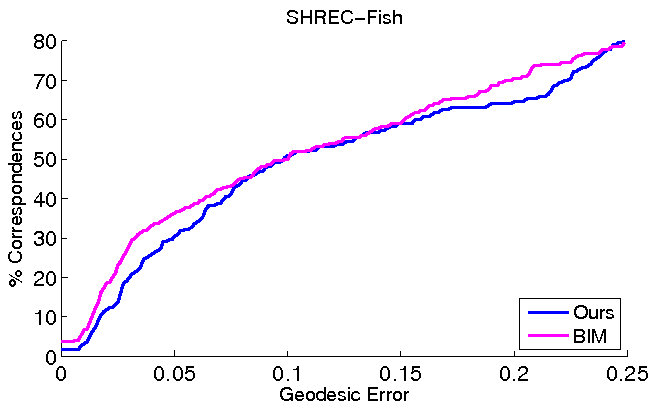
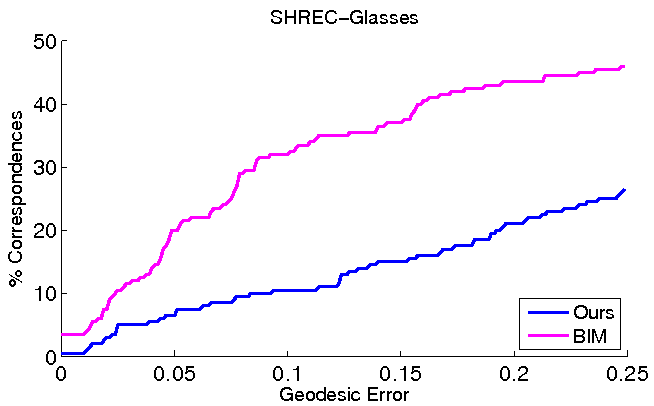
For each class, we show a figure with solid curves which illustrate the mapping results of our method and those of blended intrinsic maps. Each point on the curve describes the percentage of correspondences (y-axis) that have error below a certain geodesic distance (x-axis). Please note that all models are scaled to have unit surface area beforehand.
The link to the left of each plot goes to a web page with visualizations of the mapping results for the data set. Each row in the table illustrates the result for one pair of meshes. The left column lists a mesh pair. The second and third columns show the axis alignment and extrapolated feature point alignments, respectively with corresponding points drawn in the same color. The fourth column shows a visualization of either the computed map (correspondences shown in the same color) or the error in the map (from blue=0 to red=0.1), when ground truth vertex correspondences are available. Finally, the rightmost column shows the result computed with Blended Intrinsic Maps for comparison. The average (A) and maximum (B) error in the map is listed above each result, and results are sorted best to worst in terms of the error in our method.
| SCAPE Link to all examples |
|
NRW Link to all examples |
|
| Animals Link to all examples |
|
Humans Link to all examples |
|
| SHREC-Human |

|
SHREC-Animal |

|
| SHREC-Ant |

|
SHREC-Bird |

|
| SHREC-Plane |
|
SHREC-Plier |

|
| SHREC-Teddy |
|
SHREC-Fish |
|
| SHREC-Glasses |
|