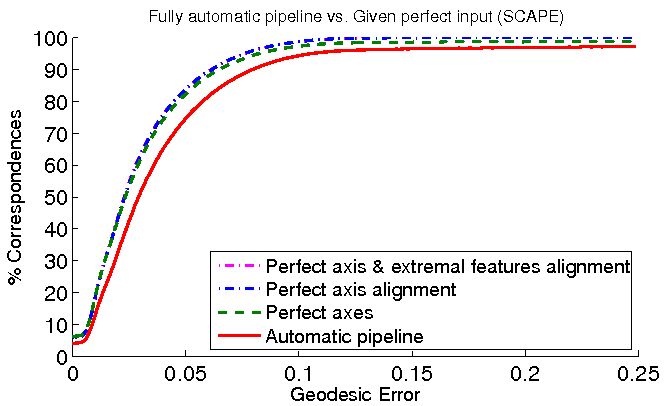
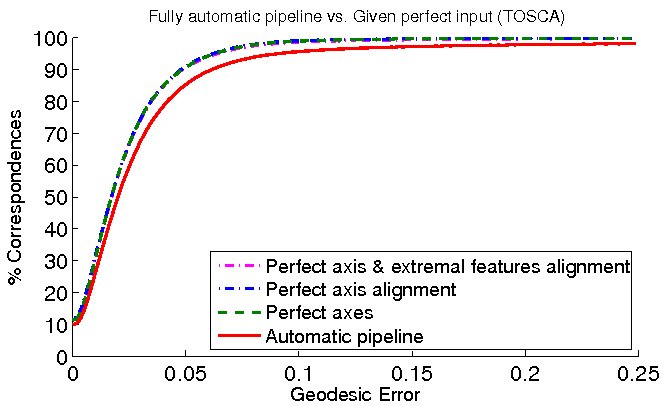
SCAPE and TOSCA classes are similar, since pairs of matched models are isometric, and we have vertex-to-vertex ground-truth correspondences, so we would like to discuss them together. From the gap between the red and the green curve, we can see that the symmetry detection step is the bottleneck of our approach in these cases. Without the perfect axes, we picked an incorrect direction for alignment in a few cases. In contrast, given the perfect axes, the mapping results are extremely close to the results obtained with the perfect axis alignment. It indicates that our axis alignment approach works well in isometric cases. Moreover, since the blue curves in both classes are very high, we are convinced that extrapolation step only causes a small error in isometric cases.
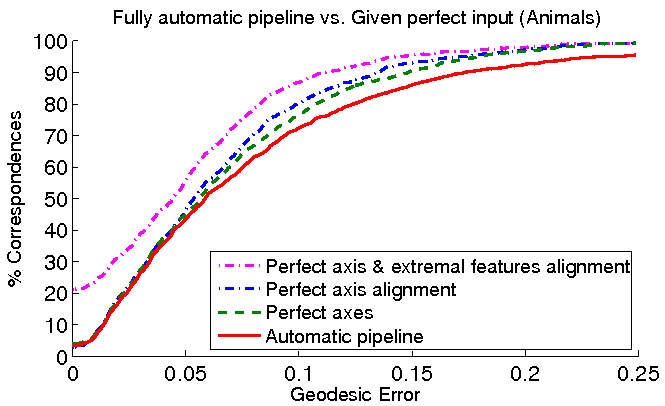
In Animals, the similarity between the blue and the green curve implies that axis alignment works well even if the models are non-isometric. The gap between the green and the red curve implies that bad axes indeed affect the accuracy of picking the optimal direction. However, since all three curves are comparatively low, it implies that the distortion caused in extrapolation step dominates in the total error.
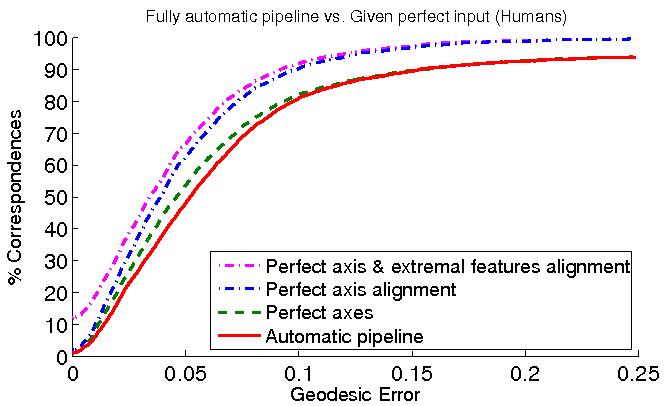
In Humans, the gap between the blue and the green curves demonstrates that the prediction of the alignment direction is still a hard problem even if the algorithm is given the perfect axes. The magnitude of the gap also shows that the shifting of the alignment along the axis affects the mapping results remarkably, which is different from the case in Animals. One possible reason is, we have a larger number of well spaced distinctive points on animal models, which aid us significantly in aligning the axis. For human models,in contrast, we can only rely on a limited number of distinctive points (e.g. chin, top of head and connection of legs) to align. Extrapolation step works better for Humans than Animals, because the human models are generally more isometric. The slight difference between the green and the red curves demonstrates that the quality of detected symmetry axes is not a bottleneck for this class.
The proximities of magenta curve to all the other curves in Animals and Humans indicate that the main source of error comes from correspondence extrapolation step, as the results do not change much even if the perfect axis alignments and extremal feature points are provided by a human to the last stage of the pipeline.
| Class Name | Plots | Class Name | Plots |
| SCAPE | |
TOSCA | |
| Animals | |
Humans | |